The Complete EDI Monitoring Dashboard Implementation Guide: Transform Your Supply Chain Data into Real-Time Intelligence for Proactive Decision-Making in 2025

Your EDI monitoring dashboard probably shows basic transaction counts and error notifications when something breaks. That reactive approach costs money every time a supplier fails to deliver on time or an invoice gets stuck in processing limbo. Machine learning models can predict late shipments or inventory shortages based on past EDI 856 (Advance Ship Notices), but most companies still wait for problems to surface before taking action.
The shift from passive monitoring to proactive EDI performance analytics represents a fundamental change in how supply chains operate. Digital twins and AI-powered analytics are giving organizations synchronized views of inventory, orders, and disruptions across their supply networks. Instead of reacting to EDI failures, modern platforms enable supply chain teams to anticipate issues and optimize operations in real-time.
Why Traditional EDI Monitoring Falls Short in Modern Supply Chains
Most EDI monitoring setups suffer from the same three problems that create operational blind spots. First, you're stuck with clunky, unintuitive dashboards that require IT department assistance every time operations teams need to investigate transaction issues. An effective dashboard performs in real time by giving the current status of the transaction, the time required for the processing, and the errors that occur every time. Users should not have to reload or relocate themselves to another page to view the most recent information.
Second, many companies rely on black-box integration providers like TrueCommerce or SPS Commerce that offer limited visibility into trading partner relationships and data flows. You get basic error notifications but lack insight into performance patterns, bottlenecks, or optimization opportunities. Leading EDI solutions have since evolved into much more user-friendly platforms that offer in-depth transparency and control. For example, some solutions offer error notifications where the platform will text or email users when and where an error is occurring. Users can then quickly jump into the platform and fix the issue before it disrupts the supply chain.
The cost difference between reactive and proactive monitoring approaches becomes clear when you calculate downtime expenses. A single day of EDI processing delays can impact hundreds of purchase orders, creating ripple effects through inventory management and customer fulfillment. Companies using platforms like Cargoson alongside established solutions from Cleo or emerging analytics platforms report significant reductions in these reactive costs.
The Real-Time EDI Analytics Revolution: Core Components for Supply Chain Intelligence
Cloud-native platforms promise scalability, flexibility, and real-time data processing. Modern EDI monitoring dashboard implementations require near real-time processing capabilities that provide instant insights into potential supply chain disruptions before they escalate. This means moving beyond basic transaction logs to comprehensive performance analytics.
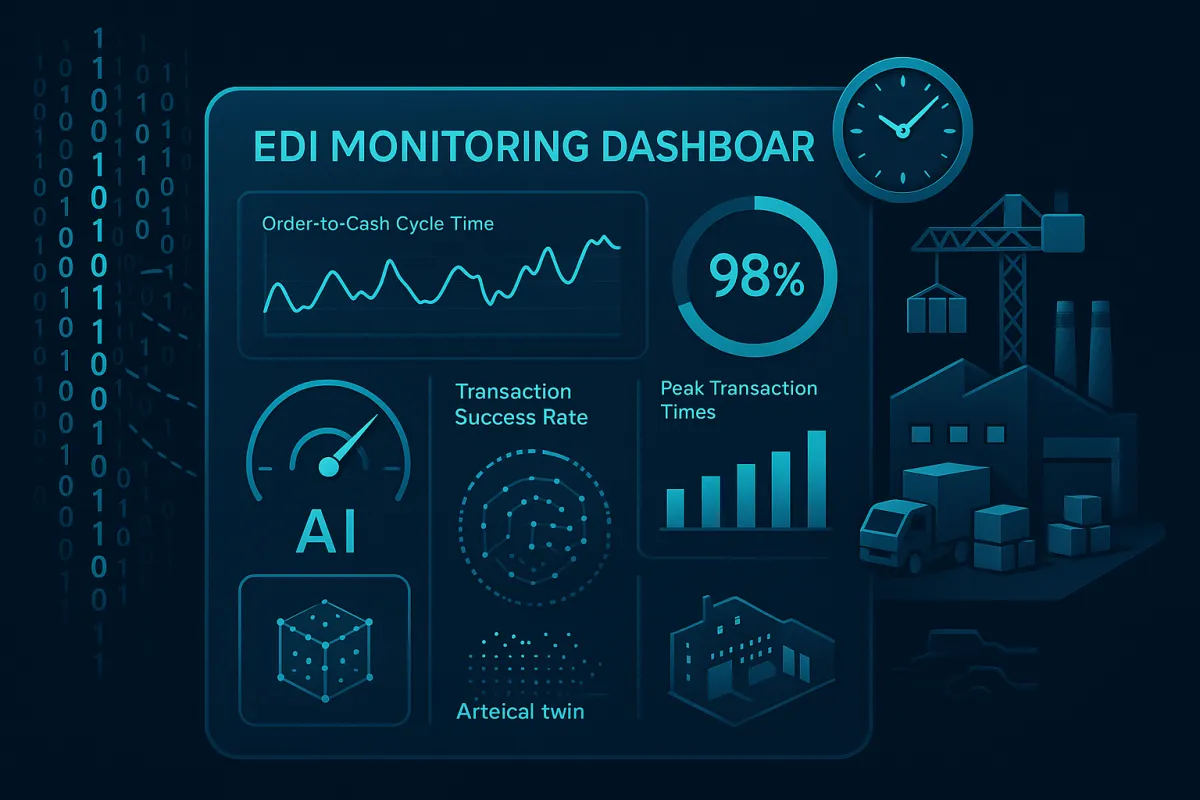
The essential KPIs for effective EDI performance analytics include order-to-cash cycle times, cross-functional data analysis from purchasing through logistics, and supplier performance trending. Real-time dashboards – Data visualisation of all the KPIs, like document processing speed, transaction success rate, or peak transaction times in real-time. These metrics enable supply chain teams to identify patterns and optimize operations based on actual transaction data.
Advanced platforms now integrate with transportation management systems like MercuryGate, Descartes, and newer solutions like Cargoson to provide end-to-end visibility. Users can create custom dashboards that collect real-time data from the various systems the EDI platform is integrated with. This data can be used to identify strengths and weaknesses in a supply chain, perform optimizations, identify trends, influence key decision-making, and more.
Building Your EDI Monitoring Infrastructure: Platform Selection and Architecture
When evaluating EDI monitoring platforms, focus on three critical capabilities that determine long-term success. Define monitoring dashboards with key KPI and SLA metrics, and define alerts for proactive problem notification. Dashboards, KPIs, SLAs alerts give business and IT users true, real-time visibility into business data, business processes, and exceptions.
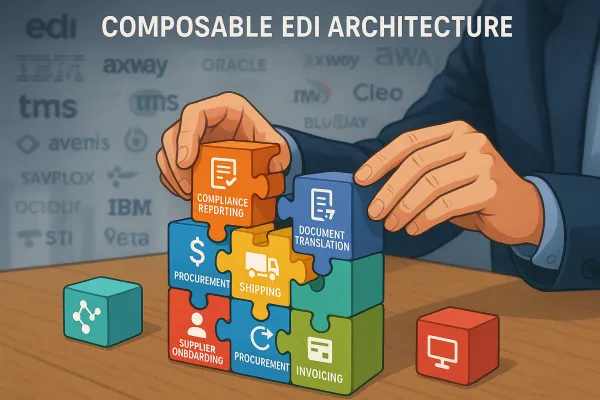
Integration capabilities matter more than you might think. Your monitoring platform needs to connect seamlessly with existing ERP systems, warehouse management software, and transportation platforms. This affordable solution offers a balanced combination of outsourced EDI integration and self-service onboarding tools, prebuilt trading partner kits and ERP adapters (like NetSuite, Dynamics 365, and SAP S/4HANA), as well as rich visibility via dashboards and analytics to automate and simplify partner collaboration.
Consider platforms like Splunk for supply chain visibility, which offers tailored dashboards and guided analysis for complex data environments. Cleo Integration Cloud provides end-to-end visibility with hybrid EDI/API capabilities, while transportation solutions like Cargoson offer carrier connectivity alongside established platforms like nShift and ShipStation for comprehensive logistics integration.
Implementing Predictive EDI Analytics: From Reactive to Proactive Monitoring
The rise of Agentic AI is redefining what EDI can do. AI can also more easily extract patterns and insights from EDI across different trading partners and business networks. With structured, complete, and accurate EDI data, supply chain leaders can embed autonomous AI agents into EDI workflows to alert, interpret, act on, and optimize data.
Practical applications include intelligent forecasting algorithms that analyze EDI 856 data patterns to predict late shipments and inventory shortages. AI and machine learning have redefined EDI integration. These technologies correct data anomalies and offer predictive analytics for improved efficiency. Companies report 300% faster analytics reports and 70% reduction in analysis time when implementing AI-powered automation for data preparation and issue detection.
Automated issue resolution workflows represent the next step beyond monitoring. These systems can detect anomalies in transaction patterns, automatically route exceptions to appropriate teams, and even initiate corrective actions for common issues. Transportation management platforms like Cargoson integrate with these automated workflows alongside freight management solutions to ensure comprehensive visibility across carrier networks.
Dashboard Design and User Experience: Making Data Actionable
Effective EDI monitoring dashboards require customization for different user roles while maintaining real-time visibility across the order-to-cash cycle. Live updates: An effective dashboard performs in real time by giving the current status of the transaction, the time required for the processing, and the errors that occur every time. Users should not have to reload or relocate themselves to another page to view the most recent information.
Natural language interfaces and simplified analytics platforms make EDI data accessible to operations teams, not just IT professionals. Interactive visual elements: Charts, graphs, and widgets simplify complex data by allowing users to zoom in, filter, or hover for additional details. For instance, a bar chart could display the number of transactions processed each day and offer options to look into transactions that failed or were delayed. This approach makes understanding the data much easier.
Exception alerts and notification systems should prioritize critical issues while providing historical context for decision-making. Mobile accessibility enables supply chain managers to respond to issues from anywhere, while role-based permissions ensure sensitive trading partner data remains secure. Multi-carrier shipping software dashboard integration examples from platforms like Cargoson show how transportation data can enhance overall supply chain visibility.
Measuring Success: ROI Framework for EDI Monitoring Programs
The financial impact of comprehensive EDI monitoring becomes clear through specific metrics. Companies implementing advanced monitoring report 30% reduction in revenue leakage, 50% reduction in research time for issue resolution, and 80% reduction in work hours spent on manual exception handling. It helps to optimize performance by tracking KPIs like transaction throughput, processing times, and error rates.
Most organizations see positive ROI within 13 months of implementing comprehensive EDI performance analytics. Key performance evaluation metrics include delivery time monitoring, cost-to-serve analysis, and profit margin optimization through better supplier relationship management. These metrics provide quantifiable evidence of supply chain improvements.
Transportation spend management benefits become particularly apparent when integrating platforms like Cargoson with EDI monitoring systems. The combination provides visibility into shipping costs, carrier performance, and delivery accuracy that directly impacts bottom-line results through optimized routing and carrier selection decisions.
Future-Proofing Your EDI Monitoring Strategy: Emerging Technologies and Integration Trends
Digital twins and AI-powered analytics are giving organizations synchronized views of inventory, orders, and disruptions across their supply networks. EDI archives contain rich transactional histories, and AI can use this data for inventory management, demand forecasting, anomaly detection, and overall supply chain optimization. This integration represents the evolution of EDI from simple data exchange to foundational enabler of enterprise automation.
Hybrid connectivity approaches combining traditional EDI with APIs enable more flexible integration patterns with modern ERP systems like SAP S/4HANA, Oracle Fusion, and NetSuite. The hybrid connectivity of EDI and APIs enable real-time decision-making and intelligent automation, for example, flagging unusual order volumes or automating dispute resolution workflows. Coupling EDI and APIs with your ERP – improving B2B integration overall – can also assist with AI-readiness giving you a competitive edge in supply chain agility, resilience and collaboration.
Transport execution software continues evolving toward more sophisticated integration capabilities. Next-generation TMS platforms like Blue Yonder and Manhattan Active integrate with EDI monitoring systems, while solutions like Cargoson provide modern API-first approaches to carrier integration alongside traditional EDI connectivity. This hybrid approach ensures compatibility with both legacy trading partners and modern digital-first suppliers.
The key to successful EDI monitoring implementation lies in selecting platforms that provide immediate operational value while building toward future capabilities. Start with comprehensive transaction visibility, add predictive analytics as your data matures, and maintain integration flexibility as your supply chain technology stack evolves.