The Complete EDI Performance Monitoring Implementation Guide: How to Build Data-Driven Dashboards That Transform Transaction Metrics Into Supply Chain Intelligence in 2025

Most EDI managers discover performance gaps the hard way: when suppliers miss delivery windows, invoices get rejected, or chargebacks arrive. Real-time metrics dashboards allow users to monitor performance in real-time, such as average document processing speed, acknowledgment latency, or peak transaction periods, while tracking KPIs like transaction throughput, processing times, and error rates.
The challenge isn't lack of data. Your EDI system generates thousands of transaction records daily. The problem is transforming that raw data stream into actionable intelligence that prevents problems instead of just documenting them after the fact.
Why EDI Performance Monitoring Transforms Supply Chain Operations
Carriers, shippers, brokers, and third-party logistics (3PL) providers all depend on accurate, timely EDI data to plan routes, confirm pickups, monitor exceptions, and complete deliveries. A single missing or unreadable EDI message can trigger delays, missed appointments, or rejected shipments.
A well-designed EDI dashboard helps businesses reduce operational costs by automating processes, preventing errors, and enhancing business efficiency through the quick processing of all operations. Automation eliminates the errors caused by manual efforts, saving time and resources required to address these errors, rework them, and avoid compliance fines. Electronic Data Interchange reduces paper-based transactions, saves the investment required to share data, and cuts mailing expenses and administrative efforts.
The visibility gap creates cascading problems. Without monitoring, you discover transaction failures hours or days late. Partners receive incomplete 856 Advance Ship Notices, resulting in receiving dock delays. Invoice discrepancies from 810 transactions lead to payment holds. Each failure costs time, money, and partner relationships.
Modern monitoring systems capture this transactional data and apply intelligence to identify patterns. Sophisticated statistical models that analyze B2B data available from various applications can help you forecast trends and needs in inventory management, logistics and all other areas requiring strategic planning.
Essential EDI KPIs Every Supply Chain Professional Must Track
KPIs such as order acceptance, invoice accuracy, delivery punctuality, ASN timeliness, and fill-rate enable you to measure, evaluate and analyze supplier performance. But measuring the right metrics requires understanding which indicators predict problems versus which simply report them.
Transaction Volume and Processing Metrics
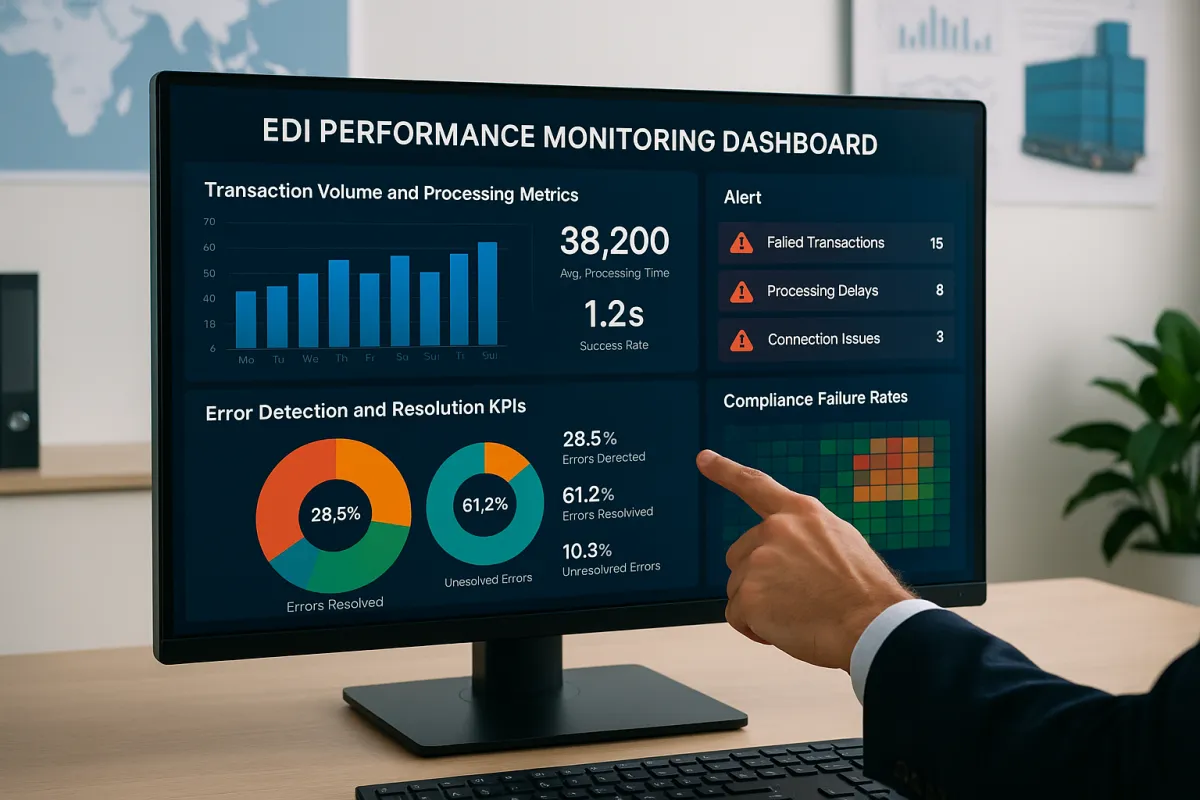
Real-time dashboards provide data visualisation of all the KPIs, like document processing speed, transaction success rate, or peak transaction times in real-time. Track these core volume indicators:
- Hourly transaction throughput by document type (850 purchase orders, 856 ship notices, 810 invoices)
- Average processing time from receipt to acknowledgment
- Peak volume periods and system capacity utilization
- Queue lengths during high-traffic periods
Processing speed matters more than you think. If your 850 purchase orders take 15 minutes to process instead of 5 minutes, that delay compounds across hundreds of daily transactions. Partners notice when your responses slow, especially during month-end or seasonal peaks.
Error Detection and Resolution KPIs
Businesses can utilize detailed logs and error codes to identify the root cause of transaction failures and resolve issues promptly. Real-time notifications and alerts via email and SMS for a failed transaction, missing acknowledgement, or processing delayed beyond defined thresholds.
- Error rates by transaction type and trading partner
- Time to resolution for failed transactions
- Repeat error patterns indicating systematic issues
- Compliance failure rates and regulatory exposure
Don't just count errors. Categorize them by root cause. Data validation failures suggest mapping problems. Transmission errors point to connectivity issues. Acknowledgment timeouts indicate partner system problems. Each category requires different remediation approaches.
Building Your EDI Dashboard Architecture: Technical Implementation
An EDI Dashboard acts like an interactive platform that provides a unified view of your EDI ecosystem. It collects data from diverse EDI systems and translates it into standard visualisation to empower users to manage and optimise their data exchange process proactively.
Start with data collection architecture. Your monitoring system needs direct access to transaction logs, not just summary reports. Most EDI platforms like Cleo, TrueCommerce, and Cargoson provide API endpoints or database views for real-time data extraction.
Design your data pipeline to capture:
- Transaction metadata (timestamps, partner IDs, document types)
- Processing status (received, validated, acknowledged, failed)
- Error details (codes, descriptions, resolution actions)
- Performance metrics (processing duration, queue wait time)
Interactive visual elements like charts, graphs, and widgets simplify complex data by allowing users to zoom in, filter, or hover for additional details. For instance, a bar chart could display the number of transactions processed each day and offer options to look into transactions that failed or were delayed.
Layer on visualization components that match user roles. Operations teams need real-time status boards. Managers require trend analysis and exception reports. Executives want executive dashboards showing partner performance scorecards and cost impact summaries.
Real-Time Monitoring and Alert Configuration
Using real-time updates on the status of individual EDI transactions, stakeholders can track the progress of critical documents and proactively find potential delays. EDI dashboards can be configured to send alerts when a specific or critical event occurs, such as a transaction failure or process delay.
Configure tiered alerting that escalates based on severity and impact. Failed 997 acknowledgments need immediate attention. Processing delays of 30+ minutes warrant investigation. Partner compliance violations require management notification.
Set up context-aware alerts that consider business rules. An 856 ship notice arriving after 6 PM Friday gets lower priority than one expected for Monday morning delivery. Peak season thresholds should differ from normal operations.
Build alert fatigue prevention into your system. Too many notifications create noise that masks real problems. Use intelligent filtering that groups related alerts and suppresses duplicates. Include automatic escalation when alerts go unacknowledged.
Advanced Analytics and Predictive Monitoring
Sophisticated statistical models that analyze B2B data available from various applications can help you forecast trends and needs in inventory management, logistics and all other areas requiring strategic planning. Machine learning models can identify patterns in transaction timing, volume fluctuations, and error clustering.
Historical analysis reveals seasonal patterns and partner behavior trends. Your dashboard should predict peak processing periods and recommend capacity adjustments. Anomaly detection flags unusual patterns that may indicate partner system issues or data quality problems.
Trend analysis and forecasting illustrate the trends using dynamic graphs over time (hourly, daily, weekly). This allows businesses to predict transaction spikes, identify recurring faults or track compliance of partners.
Build predictive models that correlate EDI transaction patterns with downstream supply chain events. Late 856 ship notices often predict delivery delays. Increased 997 acknowledgment errors may signal partner system degradation requiring proactive communication.
Integration with TMS and ERP Systems
Integrating EDI with TMS automates the exchange of critical shipping documents, reducing the need for manual intervention. This automation streamlines operations and allows staff to focus on more strategic tasks rather than repetitive data entry.
Integrating EDI with TMS creates a powerful solution that enhances visibility and control throughout the supply chain. But many ERP systems have lightweight EDI processing that struggles with transport-specific transactions like 940 warehouse shipping orders, 204 load tenders, or 214 shipment status messages.
TMS platforms like Cargoson, MercuryGate, and Descartes handle freight-specific EDI transactions that most ERPs can't process effectively. Real-time EDI updates — like EDI 214 shipment status messages — integrated into your TMS improve visibility of shipments for all parties.
Your monitoring dashboard should bridge these systems, correlating ERP purchase orders with TMS shipping confirmations and EDI acknowledgments. This unified view shows complete transaction lifecycles across system boundaries.
With EDI integrated into your TMS, these documents can move between systems instantly and accurately, without manual data entry or file uploads. That means better coordination, fewer delays, and more reliable data exchange across the transportation management process.
Implementation Best Practices and Common Pitfalls
Start with data quality foundation before building fancy dashboards. A foundation of good-quality B2B data for analysis is essential. If you are already automating your B2B processes, you are likely to have some of this critical data already upon which your analysis can be based.
Partner onboarding provides immediate ROI opportunities. McLeod users choose Bitfreighter because our platform eliminates queues for new EDI setups. New trading partners can be added in under 5 days, and new connections can be established in under 2 weeks. This significantly reduces the time from request to implementation.
Avoid dashboard proliferation. Don't create separate monitoring tools for each EDI provider or business unit. Boomi EDI dashboards can be customized to meet the needs of different user roles. For example, in the EDI dashboard, an IT administrator might focus on error rates and system performance, while a supply chain manager might look for transactional volumes. The data can be customized to give in-depth insights to different users based on their requirements.
Focus on actionable metrics over vanity metrics. Transaction volume charts look impressive but don't drive decisions. Error resolution time and partner compliance rates directly impact operations and relationships.
Monitor performance metrics regularly, keep communication channels open with trading partners, and perform regular system maintenance and updates. The seamless integration of EDI and TMS isn't just about keeping up with the times - it's about staying ahead of the curve.
Build monitoring incrementally. Start with core transaction tracking, add alerting, then layer on predictive analytics. Each phase should deliver measurable value before moving to the next level of sophistication.
Remember that monitoring systems require maintenance. Regularly monitor the TMS EDI integration to ensure that it continues to function properly and address any issues that may arise. Alert thresholds need adjustment as transaction volumes change. Dashboard layouts require updates when new partners join or business processes evolve.
Your EDI performance monitoring system becomes the foundation for supply chain intelligence. Done right, it transforms reactive firefighting into proactive optimization, turning transaction data into competitive advantage.