The Critical EDI Performance Dashboard Implementation Crisis: How 88% of TMS Integration Projects Fail to Deliver ROI and Your Complete Prevention Framework for 2026

Most companies manage 897 applications on average but only 29% are integrated, creating data silos that cripple performance monitoring. When you add EDI to the mix, you get a perfect storm of visibility gaps that destroy ROI before you even calculate it. More than 50% of TMS adopters see a positive ROI within 18 months, but here's what the surveys don't tell you: most legacy EDI systems integrations leave you in the dark when something goes wrong - a file fails, but you're not told why, or worse, you find out after your customer does, with no intuitive dashboard to track status, no alerting system to flag issues in real time.
The dashboard implementation crisis isn't just about technology. Cultural resistance represents the dominant barrier while companies allocate only 10% of transformation budgets to change management. Your EDI performance dashboard becomes another screen nobody checks because the alerts are wrong, the data is stale, and the interface requires a PhD to navigate.
The Hidden Costs of Dashboard Failures Nobody Talks About
Manual processes waste 15–20 hours per week on data entry, calls, and emails — nearly $50,000 annually for a mid-sized carrier. But that's just the visible damage. The real cost comes from the lack of visibility that forces teams to dig through logs or wait on support, which slows resolution and frustrates both IT and business users, keeping you always reacting, never ahead of the issue.
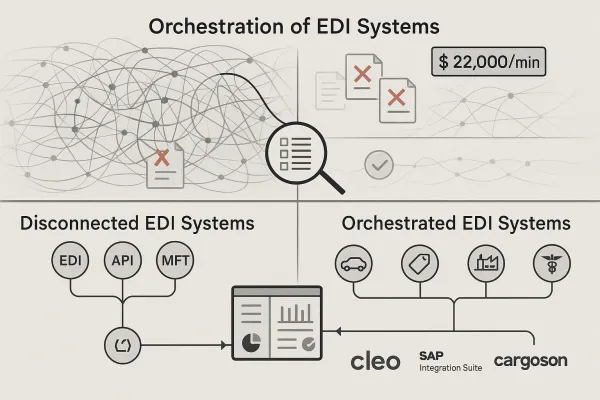
Your trading partners stop trusting your data when they're calling for shipment updates instead of checking your portal. Organizations lose $9.7-15 million yearly through operational inefficiencies and flawed decision-making, and EDI dashboard failures contribute directly to this through missed exception handling, delayed acknowledgments, and invisible transaction failures.
Consider what happens during peak shipping seasons. Cloud-native platforms usually handle spikes better because they scale automatically, so during busy periods like Black Friday or quarter-end, you won't see delays or failed messages just because volume increased. Legacy dashboard implementations can't adapt, leaving you blind during the moments you need visibility most.
Why Enterprise TMS Vendors Can't Solve the Dashboard Problem
The major players know they have a problem. Leading EDI solutions have evolved into more user-friendly platforms that offer in-depth transparency and control, with error notifications where the platform will text or email users when and where an error is occurring, allowing users to quickly jump into the platform and fix the issue. But evolution isn't the same as solving the fundamental architecture issues.
The type of EDI you deploy has a large impact on your ability to manage complexity. Managed services and cloud-based software can resolve and simplify a lot of the integration challenges. However, most enterprise implementations still struggle with the basic requirement: showing you what's broken, when it broke, and how to fix it without requiring system administrator privileges.
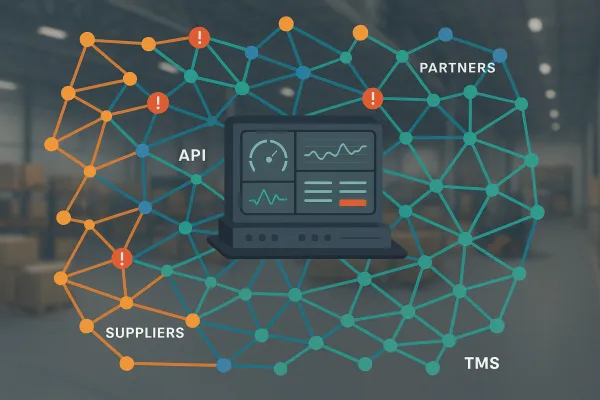
The dashboard problem gets worse with scale. Organizations average ~897 apps with only ~28% connected, and 95% of IT leaders say integration issues impede AI adoption, with the gap between AI ambitions and integration reality continuing to widen, slowing progress in 83% of organizations. Your EDI dashboard becomes one more disconnected system instead of the unifying monitoring layer it should be.
TMS Integration: Where Dashboards Go to Die
Transportation management systems create unique dashboard challenges because they handle both planning and execution data. High ROI implementations show > 20% returns indicating strong potential for short-term payback, while moderate ROI of 10-20% may justify investment if accompanied by significant qualitative benefits, but low or negative ROI < 10% suggests the TMS solution needs re-evaluation.
The dashboard is often where you first discover your TMS integration is failing. Breaking down ROI by function (planning, execution, settlement) shows where technology delivers the most favorable gains, while collaboration with security and compliance teams ensures certifications align with your risk profile and supplier obligations. But if your dashboard can't segment performance by these functions, you're measuring everything and understanding nothing.
Modern TMS platforms like Oracle Transportation Management, MercuryGate, and Cargoson offer sophisticated routing and carrier management features. However, the wrong TMS adds complexity, creates data silos, and wastes hours on manual work that should take seconds. The dashboard becomes a symptom of deeper integration problems that no amount of visual polish can fix.
The Real-Time Data Visualization Trap
Real-time data visualization is essential for EDI dashboards, providing users on-the-fly access to transaction status, system performance and relevant measures, but it must guarantee organizations can make appropriate decisions by providing complex data in a simple and comprehensible way with live updates. The problem? Most implementations focus on "real-time" but ignore the "comprehensible" part.
Your dashboard shows 847 transactions processed today, 23 exceptions, and 156 pending acknowledgments. What does that actually tell you? Interactive visual elements like charts, graphs, and widgets should simplify complex data by allowing users to zoom in, filter, or hover for additional details, such as bar charts displaying daily transaction volumes with options to investigate failed or delayed transactions.
The notification system often makes things worse. A robust notification system should help businesses stay ahead of problems by serving as a dynamic communication channel that immediately notifies users of important events, allowing them to respond immediately and prevent costly delays or compliance risks. Instead, most systems create alert fatigue with notifications for every minor processing delay.
Building Dashboards That Actually Work: The Framework
Start with user adoption, not features. A TMS only pays for itself when everybody uses it, with interfaces that mirror familiar calendar apps allowing most teams to be productive within a single shift, with the entire platform live in under two hours, meaning faster returns and fewer delays. Your EDI dashboard should follow the same principle.
Focus on exception management over comprehensive monitoring. Event-based alerts for problems like transaction failure, acknowledgment delay, or file loss should use multichannel delivery (email, SMS, in-app) and customizable triggers for specific events or thresholds like transaction volume or processing time. Most users need to know about problems, not processes.
Design for hybrid EDI-API environments. While API-based integration is growing in popularity, legacy EDI standards and protocols remain essential, with a hybrid approach offering flexibility to help organizations modernize without disrupting existing workflows, especially when APIs work with common ERPs like SAP S/4HANA, Oracle Fusion, NetSuite, and MS Dynamics 365.
Essential Dashboard Components That Drive ROI
A user-friendly interface forms the foundation of any EDI dashboard that works well, playing a key role in how users navigate and use main features, with well-designed interfaces making things simpler and offering seamless experiences. This means:
- Transaction status that updates without page refreshes
- Exception hierarchies that show critical issues first
- Partner scorecards with compliance metrics
- Integration health monitoring for ERP, WMS, and TMS connections
The key is building dashboards that solve business problems, not technology problems. TMS solutions have one of the lowest break-even points within the trucking industry, with most companies experiencing ROI within 6-12 months through substantial cost-saving benefits, with quality TMS reducing annual freight costs by an estimated 5% to 15%. Your dashboard should make these savings visible and actionable.
Future-Proofing Your Dashboard Strategy for 2026
The rise of Agentic AI is redefining what EDI can do, with the standardized nature of EDI formats requiring less data cleaning before feeding into AI models, allowing AI to more easily extract patterns and insights from EDI across different trading partners. Your dashboard architecture needs to support AI integration without requiring complete rebuilds.
Plan for the continued expansion of EDI technology, with the global market projected to reach $49.21 billion by 2027 as more organizations realize the immense value it brings. Dashboard implementations that work today but can't evolve with AI-powered analytics, predictive exception handling, and autonomous decision-making will become technical debt within 24 months.
The solution isn't more sophisticated dashboards - it's smarter integration strategies that treat monitoring as a core business requirement, not an IT afterthought. Whether you're using established platforms like IBM Sterling B2B Integrator or modern solutions like Cargoson's unified logistics platform, the dashboard success comes from understanding what your users actually need to see, when they need to see it, and how they want to act on it.