The EDI Carbon Data Goldmine: How to Transform Existing Supply Chain Transactions Into Automated Scope 3 Emissions Reporting for 2026 ESG Compliance Without Breaking Trading Partner Networks

Most companies already have a carbon data goldmine hidden in their current EDI infrastructure, but they don't know it exists. One estimate puts EDI usage in the supply chain sector somewhere between 59% and 85%. For example, nearly 70% of all sales in the manufacturing industry in the USA in 2021, for example, were carried out through EDI systems. That represents billions of transactions containing transportation data, supplier facility codes, and product specifications that can automatically feed into carbon calculations for 2026 ESG compliance requirements.
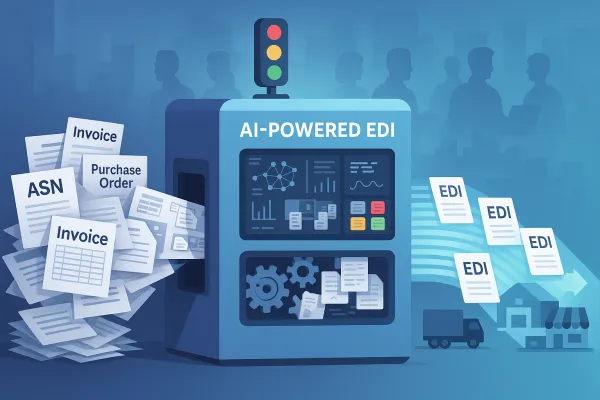
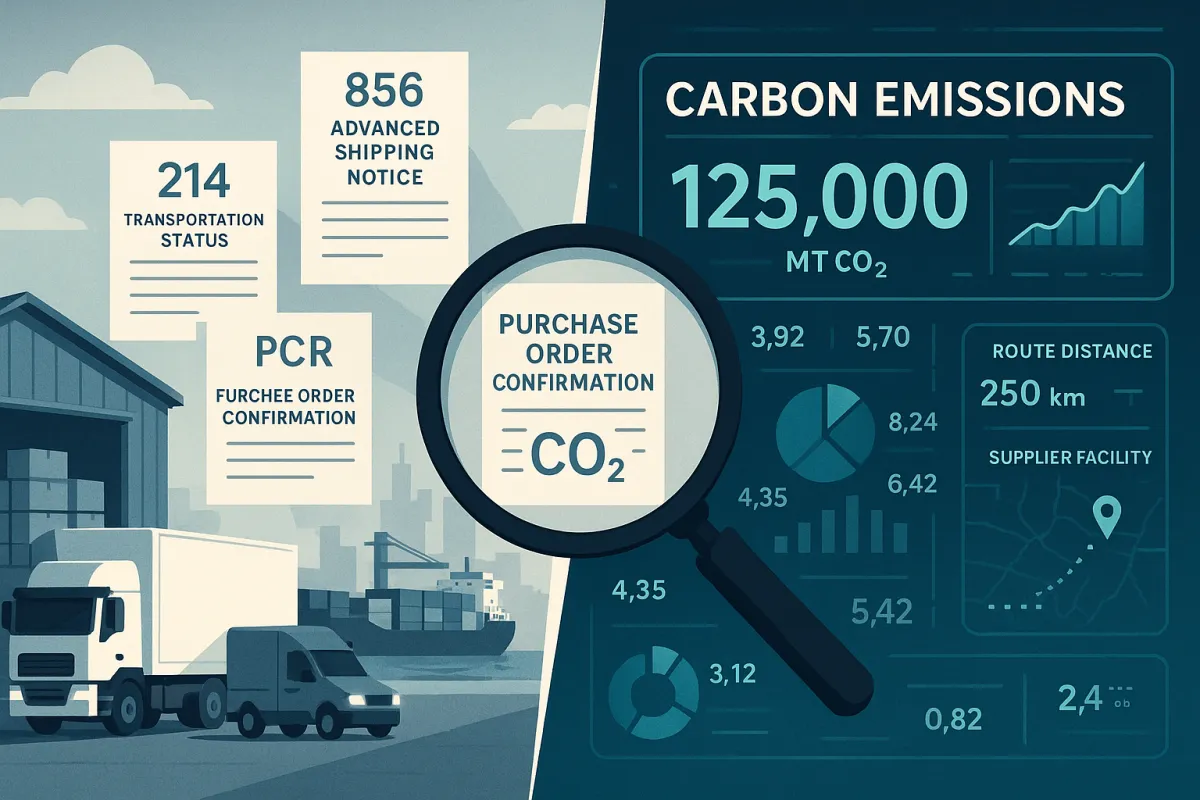
The 2026 deadline creates an interesting dynamic. 2026 is a pivotal year for ESG regulations. Scope 3 represents 70-90% of corporate carbon footprints but requires supplier collaboration. Here's what most people miss: your existing EDI carbon footprint tracking infrastructure already captures much of this data through routine business transactions. The challenge isn't collecting new information - it's recognizing the emissions intelligence already flowing through your 856 Advanced Shipping Notices, 214 transportation status messages, and purchase order confirmations.
The Hidden Carbon Intelligence in Your Current EDI Infrastructure
Your current EDI transactions contain carbon tracking data that most companies completely ignore. Every 856 ASN includes shipment weights, transportation modes, and carrier codes. Your 214 transportation status messages capture route distances and delivery confirmation timestamps. Purchase orders contain supplier facility locations that map directly to carbon intensity databases.
What Carbon Data Already Flows Through Standard EDI Transactions
Standard transportation EDI documents capture fuel consumption indicators through carrier efficiency ratings and route optimization data. By providing real-time tracking, shipment consolidation, and route optimization, EDI helps reduce fuel consumption and unnecessary trips. Product weight and volume data in your existing purchase orders enables precise transport emissions calculations using established emission factors.
Supplier facility codes in your trading partner master data connect directly to carbon intensity databases. Most companies don't realize they already receive this location data in every transaction - data that determines the carbon footprint of manufacturing processes, energy grid mix, and regional transportation networks.
The 2026 ESG Compliance Reality Check: Why EDI-Based Carbon Tracking is Mission-Critical
In 2026, if they cannot get verified ESG data from you, they face regulatory risk. The commercial consequence is simple: they will find a supplier who can provide it. This isn't theoretical pressure. If you supply companies subject to CSRD or CSDDD, expect requests for the following data from your customers' procurement or sustainability teams. Having this data ready is what keeps you in the supply chain: Carbon emissions data: Your Scope 1 (direct) and Scope 2 (purchased energy) emissions per unit of product or per year.
The sheer volume of required ESG data management and analysis has outpaced manual processing and simple spreadsheets for many companies. In 2026, leading legal and sustainability teams are adopting or planning to adopt agentic AI systems to manage compliance and automate XBRL tagging for digital filings.
The Economic Impact of Manual Carbon Tracking
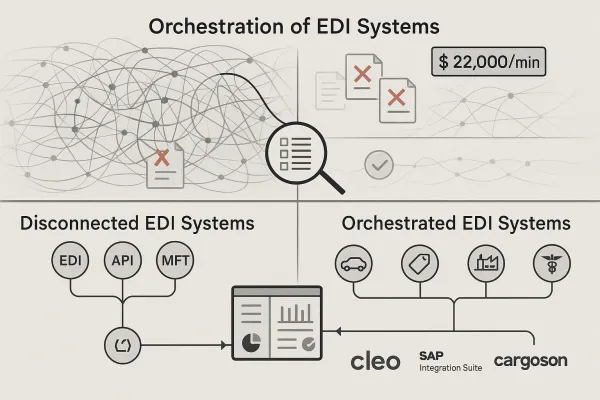
Manual carbon tracking creates duplicate data collection across multiple trading partners. When 50 different customers request carbon data using different formats and timelines, your team spends months recreating the same information. Without these principles, enterprises lack a clear understanding of what is required for all Scope 3 emissions accounting, which means that for each regulation, they must reevaluate the emissions data to meet and share the requirements of that regulation. This is extremely labor intensive and will only increase over time unless clear guidelines are established for every sector.
EDI automation transforms sustainability from cost center to competitive advantage by providing standardized, automated carbon data delivery. Instead of assembling reports manually, your system generates verified emissions data as a byproduct of normal business operations.
Step-by-Step Framework: Converting EDI Transaction Data to Carbon Metrics
The practical approach requires mapping your current data flows before building new infrastructure. Modern TMS platforms like Cargoson, MercuryGate, and Manhattan Active now integrate carbon calculations directly into routing decisions. Modern TMS platforms like Cargoson, MercuryGate, and Descartes now offer built-in carbon calculators that provide pre-calculated CO2 emission estimation before making transport booking, shifting carbon consideration from post-hoc reporting to proactive decision-making.
Phase 1: Inventory Your Current EDI Carbon Data Points
Start by documenting transportation data in your 214/210 transactions. These contain carrier codes, route segments, and fuel consumption indicators that convert directly to carbon emissions using standard emission factors. Your facility emissions data already exists in supplier master records - you're just not extracting it systematically.
Product carbon intensity flows through item master integration with purchasing systems. When your EDI system processes purchase orders, it's already capturing supplier location codes, product classifications, and quantity data needed for carbon coefficient mapping.
Phase 2: Implement Carbon Coefficient Mapping
Industry-standard emission factors from databases like Climatiq or CarbonChain integrate through APIs without disrupting existing trading partner connections. Real-time fuel consumption data feeds into carbon calculations automatically when your TMS platforms connect emission factor databases to existing transportation documents.
The key insight: carbon databases provide APIs that map directly to the facility codes, transportation modes, and product categories already captured in your EDI transactions. No new data collection required.
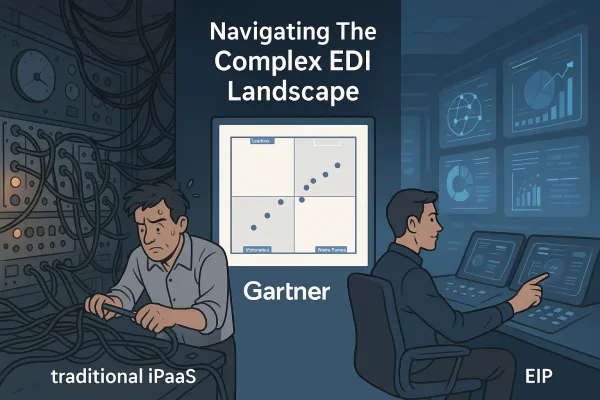
Technology Architecture: Hybrid EDI-API Carbon Intelligence Systems
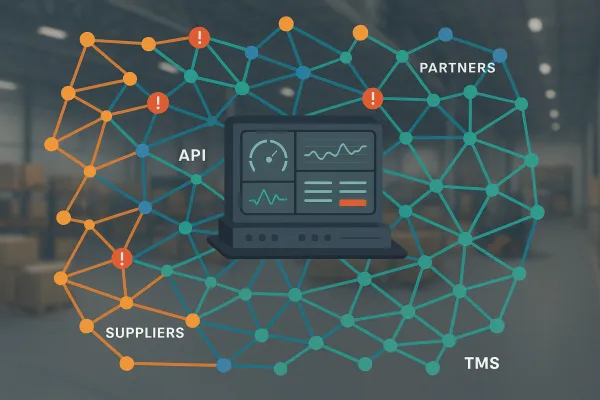
The winning approach combines EDI's reliability for complex document exchanges with APIs for real-time carbon updates. Modern cloud-based shipping software connects directly with hundreds of carriers through pre-built API and EDI integrations. Leading platforms like Transporeon, BluJay, and Cargoson demonstrate how hybrid architectures maintain trading partner stability while adding carbon intelligence.
Real-Time vs. Batch Carbon Calculations
EDI batch processing works perfectly for monthly carbon reporting cycles, while API real-time carbon scoring optimizes daily routing decisions. Rather than measuring carbon after the fact, sustainability feeds directly into transportation planning, balancing cost, speed, and environmental impact for shipments across lanes and modes.
Performance optimization becomes critical when processing thousands of transactions daily. Modern systems calculate carbon footprints during normal EDI processing cycles without impacting transaction throughput or trading partner response times.
Avoiding the $2.3M Implementation Failure Rate: Common Carbon EDI Pitfalls
Research indicates that 83% of companies find collecting accurate data to meet CSRD requirements challenging, while only one in five finance teams currently report on ESG metrics. Half of North American companies still track emissions using spreadsheets, creating accuracy and scalability issues that multiply across complex trading partner networks.
The Trading Partner Communication Strategy
Introduce carbon data requirements gradually without breaking existing EDI relationships. Start with pilot programs using 10-15% of your trading partner volume before expanding system-wide. Most partners already collect carbon data for other customers - your challenge is standardizing the format and delivery mechanism.
Successful rollout approaches maintain business continuity by implementing carbon tracking as an enhancement to existing transactions rather than requiring new business processes. Trading partners resist changes that disrupt their current operations, but they'll adopt enhancements that provide competitive advantages.
ROI Calculation Framework: Quantifying the Business Impact of EDI Carbon Tracking
The good news is that optimizing logistics to reduce costs should also reduce emissions. Using a Transport Management System (TMS) to minimise the number of trucks required and cut miles, opting for ocean transport rather than air, not only minimises costs but also emissions. Full supply chain decarbonization increases costs by only 1-4% while providing competitive advantages through improved supplier relationships and regulatory compliance.
Quantify cost reduction through automated compliance reporting. Instead of spending 40-80 hours per ESG report, your automated system generates verified carbon data in real-time. Calculate the value of avoiding regulatory penalties, securing preferred supplier status with major customers, and reducing manual data collection overhead across your organization.
ROI calculations should include risk mitigation benefits. Companies without automated carbon tracking face increasing competitive disadvantages as customers prioritize suppliers who provide verified emissions data. This positions carbon tracking as becoming as fundamental as financial tracking for transport operations. Your investment in EDI carbon intelligence protects market position while enabling new revenue opportunities through sustainability-focused partnerships.
The transformative opportunity lies in converting existing EDI infrastructure into a competitive advantage for 2026 ESG compliance. Companies that recognize the carbon intelligence already flowing through their transaction networks can automate reporting, reduce compliance costs, and secure preferred supplier status before competitors realize what they're missing.