The Hidden EDI Intelligence Gap Crisis: How to Build Performance Monitoring Frameworks That Transform Transactional Data Into Supply Chain Optimization Intelligence Without Breaking Trading Partner Networks in 2026

Your EDI system is generating 150,000 transactions monthly with a 99.7% success rate. That sounds impressive until you realize those supply chain delays are often attributable to data gaps rather than physical logistics failures.
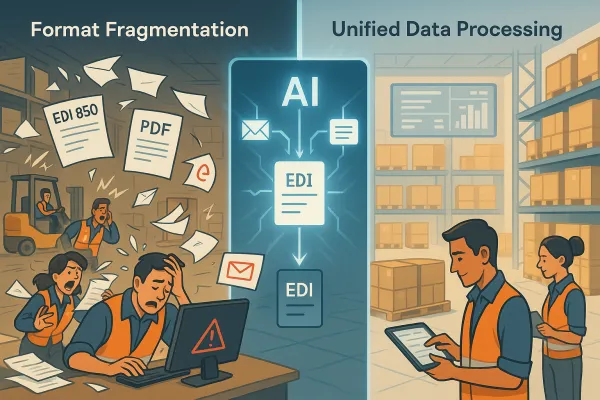
The problem isn't in your EDI processing—those purchase orders, ASNs, and invoices flow perfectly. The problem is what happens to all that transactional intelligence once it disappears into your systems. EDI archives contain rich transactional histories, and AI can use this data for inventory management, demand forecasting, anomaly detection, and overall supply chain optimization. But most companies treat EDI like a messaging service instead of a performance data goldmine.
You're sitting on $2.4 million worth of hidden operational intelligence.
The $2.4M Intelligence Gap Hidden in Your EDI Operations
Here's what happens in most organizations: EDI transactions process successfully, but performance degradation patterns remain invisible for weeks. Your carrier starts missing delivery windows by 8% more than their baseline. Your key supplier's quality metrics drift downward by 12%. Seasonal demand patterns shift, but your system only shows you what happened last month.
Meanwhile, platforms like SPS Commerce and TrueCommerce handle millions of transactions but often provide limited performance intelligence beyond basic dashboard reporting. Continuous performance monitoring replaces periodic planning. Successful trading partners share daily visibility into demand patterns, fill rates and inventory positions. Automated alerts identify supply-demand misalignment before stockouts or revenue leakage occur.
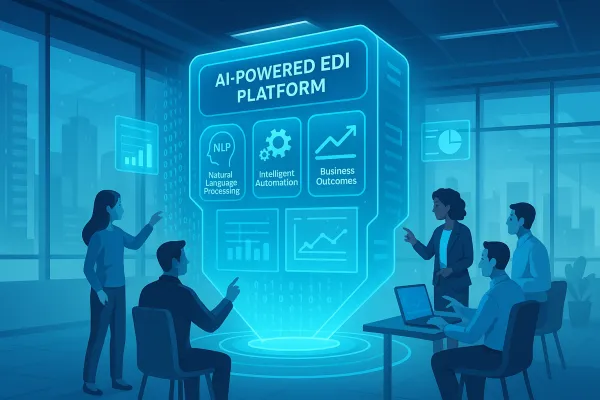
Modern platforms like Cargoson are addressing this gap by building analytics directly into the transaction flow, providing real-time performance intelligence that transforms EDI from a data exchange tool into an operational optimization engine.
The cost of this intelligence gap compounds quickly. Late shipment notifications trigger expedited freight costs averaging $847 per incident. Quality issues discovered after goods receipt cost 4x more to resolve than early detection. Stockouts from invisible demand shifts typically run $15,000-40,000 in lost revenue per SKU.
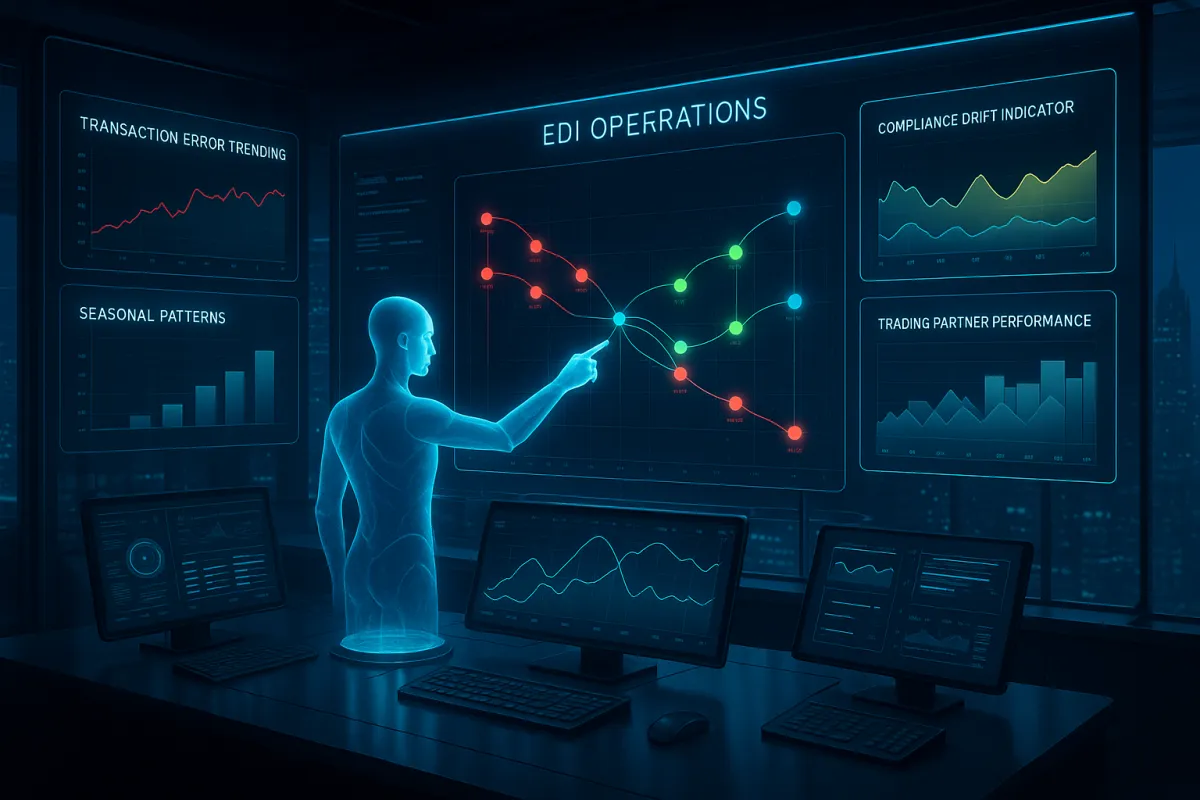
The Four Critical Performance Blind Spots in Traditional EDI Systems
Trading Partner Performance Degradation develops gradually and often stays hidden until it becomes critical. Your EDI 856 ASNs arrive on time, but delivery performance slides from 94% to 86% over six weeks. Traditional monitoring shows successful transaction counts, not performance trends.
Transaction Error Trending reveals operational problems before they cascade. When your supplier's EDI 810 invoices start showing 15% more price discrepancies, that signals procurement process breakdown or catalog data drift. Effective error management and compliance are critical for maintaining smooth EDI operations and strong trading partner relationships. Proactively addressing these areas can help prevent costly chargebacks, delays, and other supply chain disruptions.
Seasonal and Cyclical Patterns shift without notice. Your EDI 850 purchase order volumes typically increase 23% in Q4, but this year they're up 31% by October. That 8% delta signals demand pattern changes that require proactive capacity adjustments.
Compliance Drift Indicators appear in transaction quality before formal violations. When your EDI 214 shipment status messages start arriving 3 hours later than usual, that indicates carrier system stress that often precedes service failures.
Legacy systems from MercuryGate and Descartes provide transaction processing but lack the analytics layer needed to surface these patterns. Modern platforms like Cargoson integrate performance intelligence directly into the transaction flow, making operational degradation visible in real-time rather than after quarterly reviews.
Building Real-Time Performance Intelligence Architecture
Your performance intelligence framework needs three core components: transaction stream processing, pattern recognition algorithms, and automated alerting systems. The analysis your team needs to do on freight data, carrier performance, market trends, and cost scenarios is getting more complex, not less. Having a direct API connection from your TMS into these AI platforms means your analysts can pull operational data and run sophisticated queries, build custom reports, generate scenario analyses, and surface insights without needing a data science team or waiting weeks for IT to build a custom report. This capability turns your TMS from a transaction system into an analytical engine your people can actually interact with.
Start with your high-volume transaction types. Extract performance metrics from EDI 850s (order accuracy, processing time), EDI 856s (shipment reliability, lead time variance), and EDI 810s (invoice accuracy, payment cycle timing). Build real-time pipelines that calculate rolling averages, detect variance thresholds, and trigger alerts when performance degrades beyond acceptable limits.
Integration with existing systems requires careful architecture. Your performance intelligence layer sits between your EDI processor and your ERP, TMS, or WMS systems. Whether you're running Oracle TM, SAP TM, Blue Yonder, or modern platforms like Cargoson, the intelligence framework needs API connectivity to pull transaction metadata and push performance alerts.
What used to be a back-office EDI system running batch EDI transactions is now expected to support real-time, omnichannel commerce, tight EDI integration for supply chain visibility, and seamless integration with cloud business systems such as ERPs, WMS, TMS, ecommerce platforms, and 3PLs. Modern integration platforms address this by connecting EDI to your broader integration and automation strategy, tying it into ERPs, CRMs, WMS, TMS, ecommerce storefronts, and analytics platforms.
Critical KPIs and Metrics Framework
Establish baseline performance metrics across document types. For EDI 850 purchase orders: order-to-acknowledgment cycle time (target: <4 hours), data accuracy rate (target: >99.5%), and exception handling time (target: <2 hours). Track these against trading partner performance over rolling 30-day windows.
For EDI 856 advance ship notices: forecast accuracy variance, on-time shipment rate, and delivery window compliance. Set thresholds that trigger alerts when performance drops 10% below baseline or shows declining trends over 7-day periods.
Invoice processing through EDI 810s requires different metrics: invoice-to-payment cycle time, pricing accuracy rate, and dispute resolution time. Monitor these alongside cash flow impact calculations to quantify the financial effect of performance changes.
Advanced Pattern Recognition and Predictive Analytics Implementation
Digital twins and AI-powered analytics are giving organizations synchronized views of inventory, orders, and disruptions across their supply networks. AI is increasingly performing prescriptive analysis, helping supply chain leaders understand the impact of possible decisions before making them. Apply these concepts to your EDI transaction streams.
Machine learning models trained on 12-24 months of EDI transaction history can predict performance degradation 2-4 weeks before it becomes visible through traditional metrics. Look for correlation patterns between transaction volume changes, processing delays, and subsequent operational issues.
Implement anomaly detection algorithms that identify unusual patterns in your EDI flows. When your normally reliable supplier shows EDI 855 acknowledgment delays increasing from 47 minutes average to 73 minutes, that often predicts capacity constraints that will affect delivery performance.
Vendors like Cargoson are building AI-native platforms that embed predictive analytics directly into the EDI processing pipeline, enabling proactive optimization rather than reactive problem-solving. Machine learning models trained on historical supply chain data can predict delays, demand shifts, and supplier failures 2-6 weeks in advance — enabling intervention before disruption occurs.
Partner Performance Benchmarking and Optimization Strategies
Build comparative performance scorecards using EDI transaction metadata. Track each trading partner's performance across multiple dimensions: transaction processing speed, data accuracy, exception rates, and response times to EDI communications.
Create performance quartiles among your trading partners. Partners in the bottom quartile require different management approaches—more frequent communication, earlier capacity reservations, or backup sourcing strategies. Use this intelligence to negotiate better terms with top performers and develop improvement plans for struggling partners.
Implement automated partner performance reviews. When a supplier's EDI performance drops below defined thresholds for three consecutive weeks, automatically generate performance review meetings and improvement action plans. Digital supplier portals with shared KPIs, order visibility, and performance dashboards reduce supplier lead time variability by 20-35% through alignment and accountability.
Implementation Roadmap and Risk Mitigation
Start with your highest-volume trading relationships and most critical transaction types. Implement monitoring for 3-5 key partners representing 60%+ of your EDI transaction volume. This provides meaningful performance intelligence while limiting implementation complexity.
Phase your rollout over 90 days. Week 1-2: establish baseline metrics collection. Week 3-6: implement basic alerting and dashboard reporting. Week 7-10: add predictive analytics and pattern recognition. Week 11-12: full integration with operational systems and automated response protocols.
Maintain parallel monitoring during implementation. Keep your existing EDI processes running normally while the intelligence framework captures and analyzes transaction streams. This allows you to validate accuracy before cutting over to automated decision-making.
When evaluating vendors like nShift, Transporeon, or Alpega against modern platforms like Cargoson, prioritize solutions that provide native performance intelligence rather than bolt-on analytics modules. The best tools supply chain orchestration 2026 unify connectivity across API, EDI, and MFT, provide real-time visibility, and support coordinated action at scale. Cleo positions its approach as AI-native and states it can resolve operational disruptions 85% faster than legacy integration middleware.
Cost-Benefit Analysis and ROI Measurement Framework
Calculate your baseline cost of EDI performance blind spots. Track monthly costs from expedited freight triggered by late supplier notifications, quality issues discovered after receipt, stockouts from demand pattern changes, and administrative time spent investigating EDI transaction issues.
Typical mid-market companies processing 100,000+ EDI transactions monthly see 4-8% operational cost reduction through performance intelligence implementation. This translates to $180,000-420,000 annual savings for companies with $25M+ supply chain spend.
Measure implementation ROI across three categories. Direct cost savings: reduced expedited freight, fewer quality escapes, optimized inventory levels. Operational efficiency gains: reduced manual investigation time, faster exception resolution, improved trading partner compliance. Revenue protection: prevented stockouts, improved customer satisfaction, reduced penalty payments.
Track payback timeline carefully. Most performance intelligence initiatives show positive ROI within 6-9 months, with break-even typically occurring around month 4-5. Calculate your specific ROI using your transaction volumes, current exception costs, and estimated efficiency improvements.
The difference between successful and failed EDI performance intelligence projects often comes down to treating it as an operational capability rather than a technology implementation. Focus on building processes that turn intelligence into action, not just better dashboards that still require manual interpretation.